Introduction
This weather station project with ESP8266 and TFT display is just what you need if you’ve ever wanted to have instant access to the weather forecast for your area without having to open an app on your phone or a website. With the help of an ESP8266, a powerful Wi-Fi microcontroller, and a 1.8-inch TFT display, you can create a weather station that can provide detailed real-time weather information right on your desk or desk.
In this article, I will walk you step by step in creating this device, which queries a weather forecast service via a REST API to get updated data on temperature, humidity, barometric pressure, weather description, and forecast time. In addition to providing quick access to forecasts, this project is a great example of how modern IoT (Internet of Things) technologies can make our daily lives simpler and more efficient.
You will discover how to establish a Wi-Fi connection with your ESP8266, how to send requests to the OpenWeatherMap API, and how to parse the returned JSON document to extract the data of interest. Finally, you will learn how to display this information clearly and legibly on your TFT display.
Also in this project we will use the excellent PlatformIO as an IDE.
Ready to dive into the interesting world of creating custom IoT devices? So let’s proceed with the creation of this intelligent weather station.
OpenWeatherMap is a trusted and essential resource for meteorology enthusiasts, developers and creators of weather-related projects. It is an online weather forecast service that offers accurate and updated real-time weather data from around the world. Founded in 2012, OpenWeatherMap provides a wide range of weather information, including temperatures, humidity, air pressure, wind and much more. But what makes OpenWeatherMap truly remarkable is the free access to the API (Application Programming Interface), which allows programmers and hobbyists to integrate this valuable information into their personal projects. The OpenWeatherMap API offers a broad range of weather data, allowing developers to build applications, IoT devices, and services that offer local and global weather forecasts. Its ease of use, combined with global coverage and data accuracy, make it an irreplaceable tool for anyone with an interest in monitoring and analyzing current and future weather conditions.
REST APIs
REST APIs (Application Programming Interface – Representational State Transfer) are a fundamental communication standard in the world of software and information technology. This architectural approach is designed to enable communication and data exchange between software systems, applications and services effectively and efficiently. REST APIs are based on a few key principles:
- Data representation: resources (data) are represented in a standard format, often using JSON or XML, that is easily understandable by applications.
- Statelessness (zero state): each request between client and server is self-sufficient and does not depend on the previous state. This means that each request contains all the information necessary to be processed successfully.
- Standard operations: REST APIs use standard HTTP methods, such as GET (to retrieve data), POST (to create new resources), PUT (to update existing resources), and DELETE (to remove resources).
- URI (Uniform Resource Identifier): each resource is identified by a unique URI, which allows direct access to specific data or services.
REST APIs are widely used in web applications, cloud services, mobile apps, and IoT systems. They allow the integration and exchange of data between different platforms and programming languages. REST APIs are highly scalable and reliable, making them ideal for applications that require high performance and need to serve a large number of users.
Additionally, REST APIs promote a clear separation between the frontend (user interface) and the backend (business logic), which simplifies application development, maintenance, and upgrades. This architecture has revolutionized the way applications interact with each other and with data, helping to create an ecosystem of interconnected services that powers much of the digital world we live in.
The JSON format
JSON, an acronym for “JavaScript Object Notation”, is a lightweight and highly flexible data exchange format. It has become a de facto standard for transmitting and exchanging information between applications and services on the Internet. Its key features include:
Simplicity and readability: the JSON format is based on a structure of key-value pairs and is written in a human-readable language. It is very similar to the object syntax in JavaScript, which makes it easier for developers to understand.
Hierarchical structure: JSON supports structured and hierarchical data. JSON objects can contain other objects or arrays, allowing you to represent complex data in a well-organized format.
Language independence: JSON is programming language independence, meaning it can be used in a wide range of languages, including JavaScript, Python, Java, C#, and many others.
Wide adoption: JSON is widely used in web applications, RESTful services, APIs, and many other situations where data exchange is necessary.
Browser Compatibility: because JSON is natively supported in web browsers, it is an ideal format for transmitting data between clients and servers in web applications.
Data representation: JSON can represent a variety of data, including numbers, strings, Booleans, objects, arrays, and null values. This flexibility makes it suitable for a wide range of applications.
Convenience in processing: the human-readable nature of JSON makes it easy for both applications and human developers to process data. Many languages offer libraries or modules for parsing and generating JSON data.
In summary, JSON is a highly versatile and universally accepted data format that simplifies communication and data exchange between heterogeneous applications. Its simplicity and flexibility make it an essential tool for developing web applications and web services.
TFT displays
Thin-Film Transistor (TFT) displays represent a category of advanced liquid crystal displays (LCDs) that have established themselves as one of the most popular and versatile display technologies. Here are some key points to consider:
Image Quality: TFT displays are known for delivering high-quality images with brilliant colors and sharp details. This makes them ideal for a wide range of applications, from viewing photos and videos to UI applications.
Backlight: most TFT displays use LED backlight, which provides a uniform light source and allows images to be viewed even in bright environments. This backlight is adjustable as needed, which helps save energy.
Resolution: TFT displays are available in various resolutions, from small 1.8-inch screens with QVGA resolution to larger screens with Full HD resolutions or higher. The choice of resolution depends on the specific needs of the application.
Touchscreen: many TFT screens feature capacitive or resistive touchscreen technology, which allows direct user interaction with the display. This is widely used in mobile, tablet, ATM and other interactive devices.
Wide Applicability: TFT displays are used in a wide range of devices, including smartphones, tablets, monitors, televisions, smart watches, medical diagnostic tools, GPS, industrial automation devices and much more.
Connections and Controls: TFT displays are designed for integration with various types of controllers and microcontrollers. This makes them ideal for implementation in DIY electronics projects and custom applications.
Power Consumption: TFT technology is designed to maintain low power consumption whenever possible, making it suitable for battery-powered devices.
Choice of type: in addition to color TFT displays, there are also grayscale, monochrome, and high-brightness TFT displays designed for specific applications.
In conclusion, TFT displays are a popular and reliable choice for many applications, thanks to their image quality, versatility and ease of integration. They have become an integral part of our daily lives, contributing to the visual experience in devices of all kinds.
Subscription to the Openweathermap service
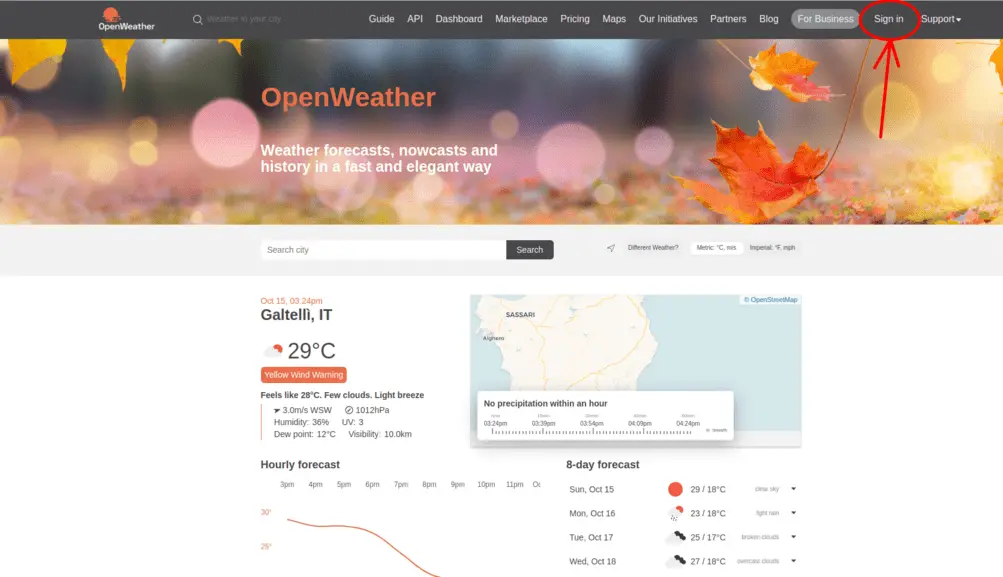
First of all you will have to sign up for free to the Openweathermap service. Once on the home page you will have to click on the “Sign in” item:
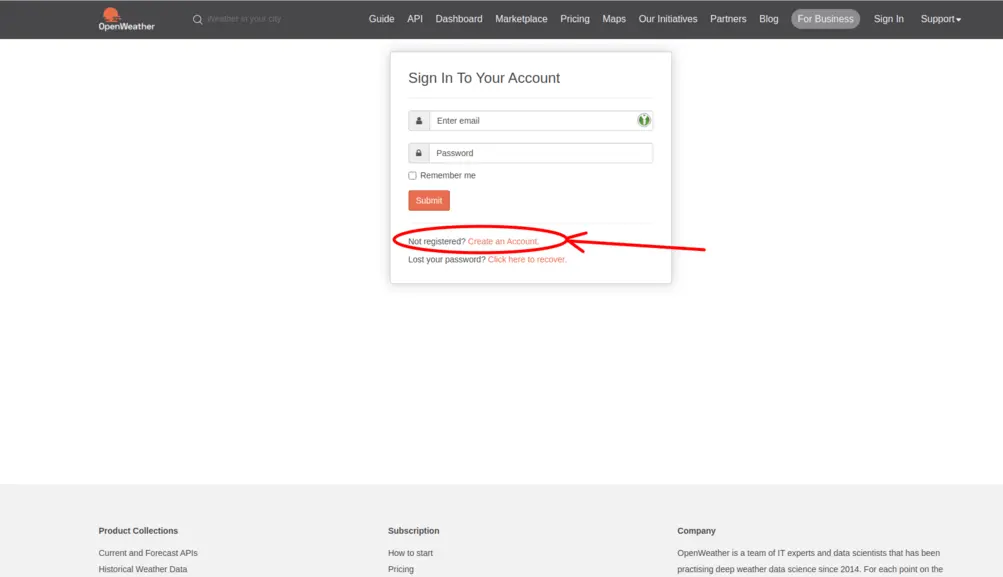
On the next page click on Create an Account:
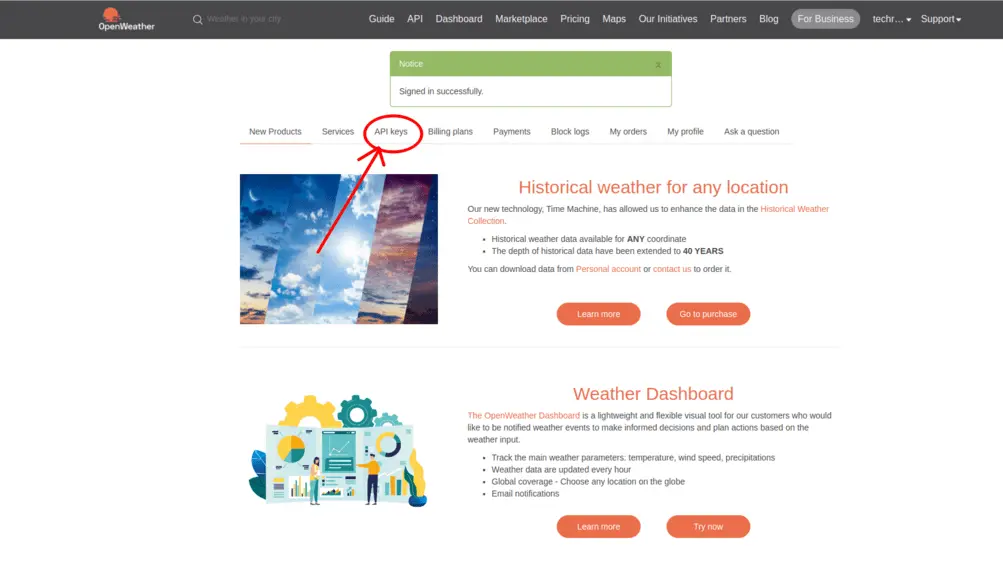
After completing the account creation operation, go to the Home page and click on API keys:
You will arrive at the main page from which you will have to copy your key:
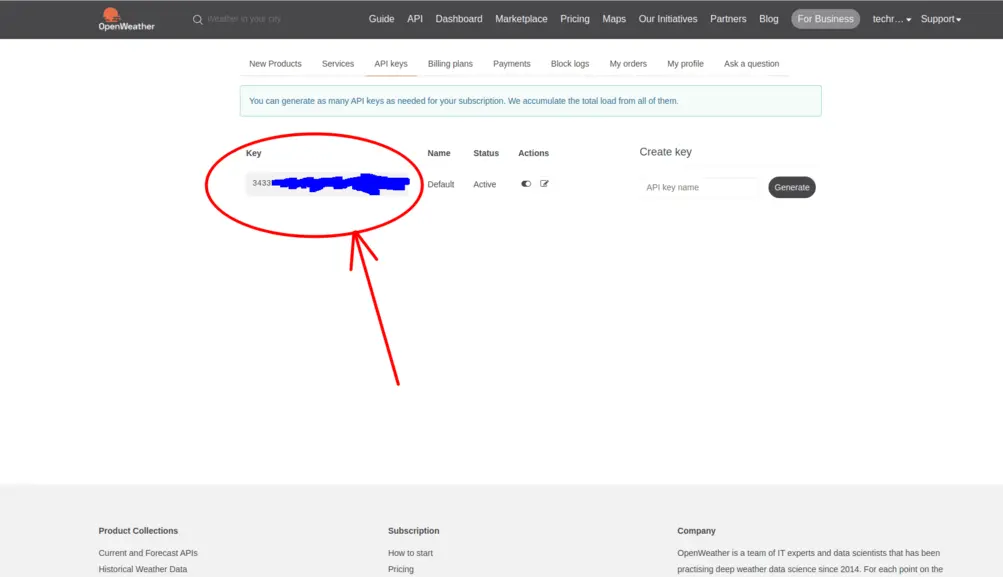
Keep this key because you will have to use it later in the sketch that you will upload to the ESP8266 in order to be identified by the service as a registered user.
Test the Openweathermap API
To make sure everything works correctly, you can first test the Openweathermap API very easily on your browser.
You must first compose the URL to submit to the browser. It will have the following structure:
https://api.openweathermap.org/data/2.5/forecast?q=CITY,COUNTRY&APPID=PERSONAL_KEY&mode=json&units=metric&cnt=3
where CITY is the city whose weather conditions you want to know, COUNTRY is the country where the city is located, PERSONAL_KEY is the key you just saved from the Openweathermap portal, mode is the document format returned (in this case a Json ), units is the measurement system (in this case the metric system), cnt is the number of predictions returned (in this case 3).
Let’s take an example with the city of Rome in Italy. The url will be:
https://api.openweathermap.org/data/2.5/forecast?q=Roma,IT&APPID=KKKKKKKKKKKKKKKKKK&mode=json&units=metric&cnt=3
Obviously I obscured my private key.
I got this Json document as a result on my browser:
{
    "cod": "200",
    "message": 0,
    "cnt": 3,
    "list": [
        {
            "dt": 1697446800,
            "main": {
                "temp": 20.12,
                "feels_like": 19.88,
                "temp_min": 20.12,
                "temp_max": 22.7,
                "pressure": 1014,
                "sea_level": 1014,
                "grnd_level": 1010,
                "humidity": 65,
                "temp_kf": -2.58
            },
            "weather": [
                {
                    "id": 803,
                    "main": "Clouds",
                    "description": "broken clouds",
                    "icon": "04d"
                }
            ],
            "clouds": {
                "all": 75
            },
            "wind": {
                "speed": 2.93,
                "deg": 129,
                "gust": 4.84
            },
            "visibility": 10000,
            "pop": 0.1,
            "sys": {
                "pod": "d"
            },
            "dt_txt": "2023-10-16 09:00:00"
        },
        {
            "dt": 1697457600,
            "main": {
                "temp": 21.09,
                "feels_like": 20.87,
                "temp_min": 21.09,
                "temp_max": 23.03,
                "pressure": 1014,
                "sea_level": 1014,
                "grnd_level": 1010,
                "humidity": 62,
                "temp_kf": -1.94
            },
            "weather": [
                {
                    "id": 500,
                    "main": "Rain",
                    "description": "light rain",
                    "icon": "10d"
                }
            ],
            "clouds": {
                "all": 83
            },
            "wind": {
                "speed": 4.56,
                "deg": 162,
                "gust": 5.58
            },
            "visibility": 10000,
            "pop": 0.27,
            "rain": {
                "3h": 0.47
            },
            "sys": {
                "pod": "d"
            },
            "dt_txt": "2023-10-16 12:00:00"
        },
        {
            "dt": 1697468400,
            "main": {
                "temp": 21.83,
                "feels_like": 21.66,
                "temp_min": 21.83,
                "temp_max": 22.69,
                "pressure": 1013,
                "sea_level": 1013,
                "grnd_level": 1009,
                "humidity": 61,
                "temp_kf": -0.86
            },
            "weather": [
                {
                    "id": 500,
                    "main": "Rain",
                    "description": "light rain",
                    "icon": "10d"
                }
            ],
            "clouds": {
                "all": 92
            },
            "wind": {
                "speed": 4.94,
                "deg": 169,
                "gust": 6.4
            },
            "visibility": 10000,
            "pop": 0.6,
            "rain": {
                "3h": 0.37
            },
            "sys": {
                "pod": "d"
            },
            "dt_txt": "2023-10-16 15:00:00"
        }
    ],
    "city": {
        "id": 3169070,
        "name": "Rome",
        "coord": {
            "lat": 41.8947,
            "lon": 12.4839
        },
        "country": "IT",
        "population": 15000,
        "timezone": 7200,
        "sunrise": 1697433766,
        "sunset": 1697473700
    }
}
from which the information we need can be extracted.
What components do we need for our weather station project with ESP8266 and TFT display?
The list of components is not particularly long:
- a breadboard to connect the ESP8266 NodeMCU to the other components
- some DuPont wires (male – male, male – female, female – female)
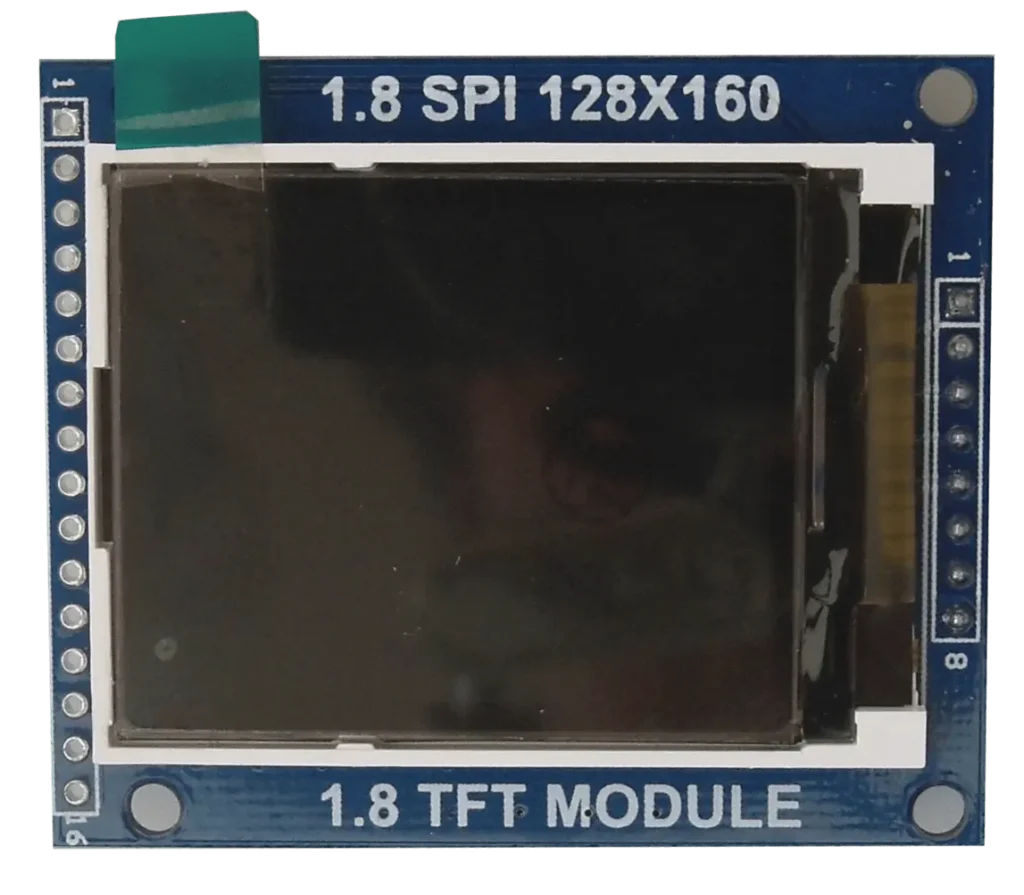
- a TFT 1.8″ display
- and, of course, one NodeMCU ESP8266 !
Let’s see in the following photo the type of TFT display used in this project:
Project implementation
The wiring diagram
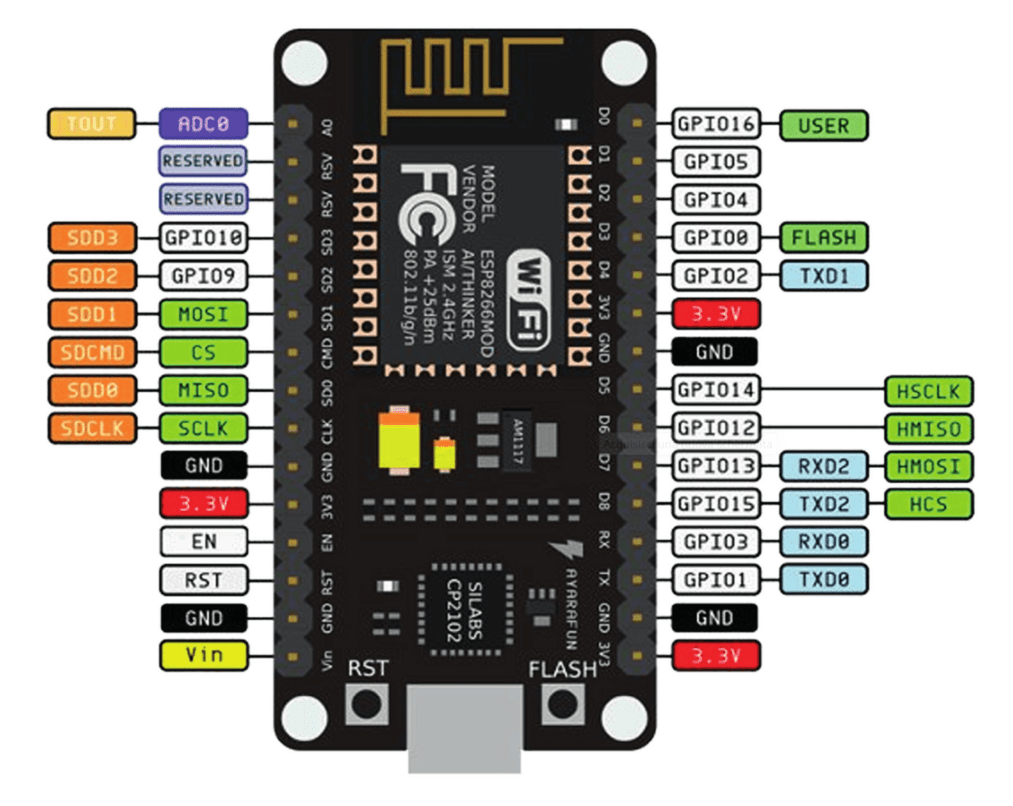
Before creating the actual circuit let’s take a look at the pinout of the board:
Let’s also see the display pinout:
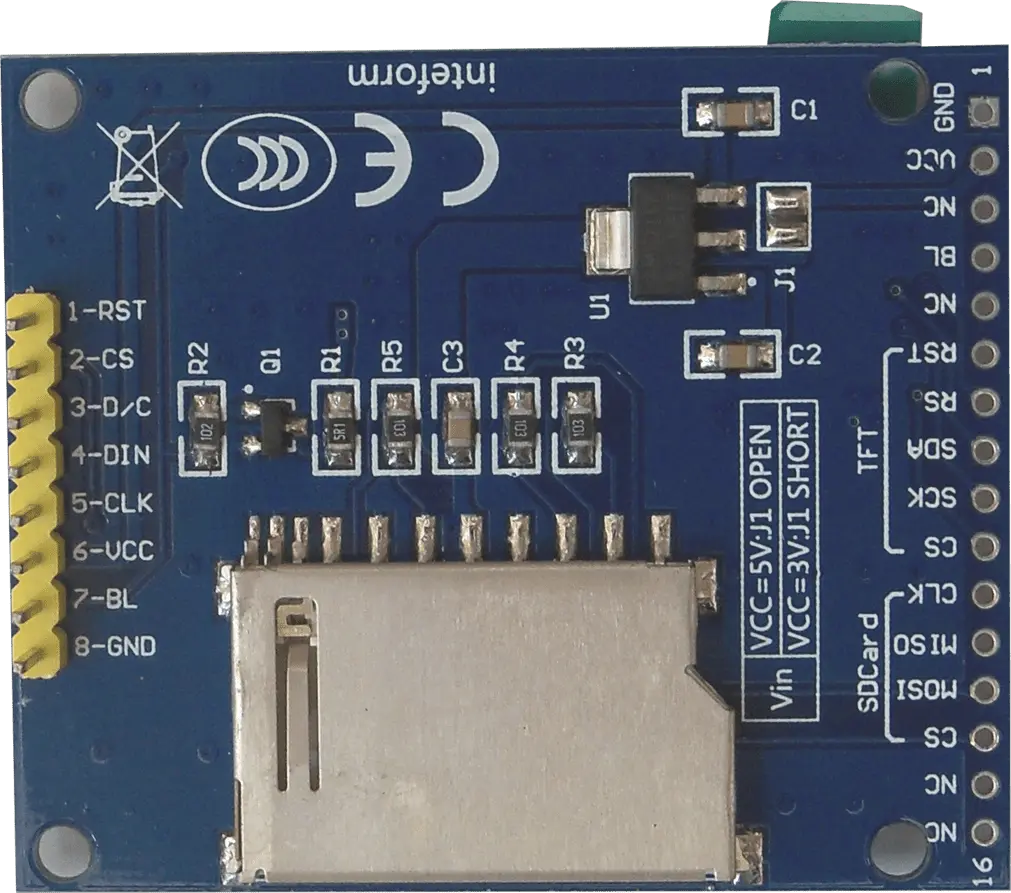
For our project we will only consider the pins on the left side (with yellow connector on this photo).
Typically this display is already sold with the connector mounted but if yours doesn’t have it and you need to solder it, I recommend you take a look at article Yet another tutorial on how to solder first to learn how to make a perfect solder.
Before moving on to the wiring diagram you will need to carry out a small operation. The display can work at both 5V and 3.3V but since the digital pins of the ESP8266 do not tolerate voltages higher than 3.3V we will have to prepare the display to work with this voltage.
To do this we will simply have to short circuit jumper J1 i.e. the one shown in the following photo:
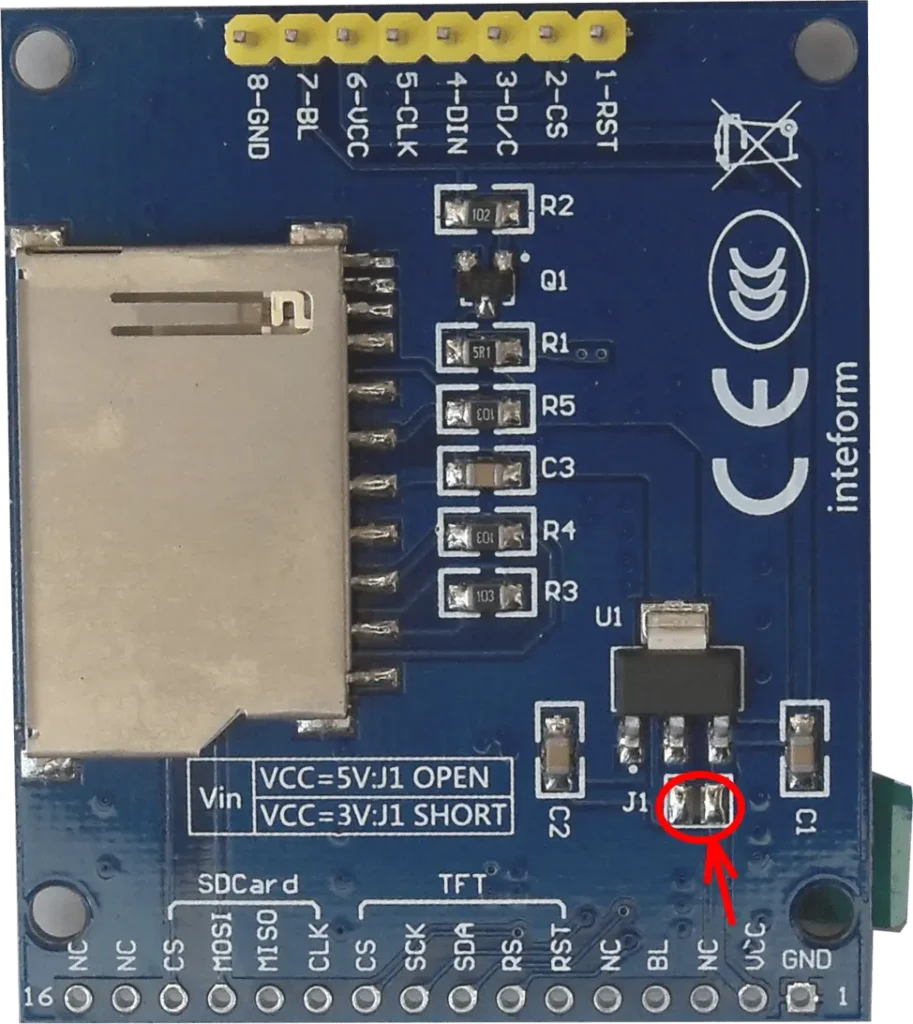
As you can see, it is a fairly simple operation: a small drop of tin is enough to short-circuit the two pads indicated in red.
Let’s now see the electrical diagram of the project, created as usual with Fritzing.
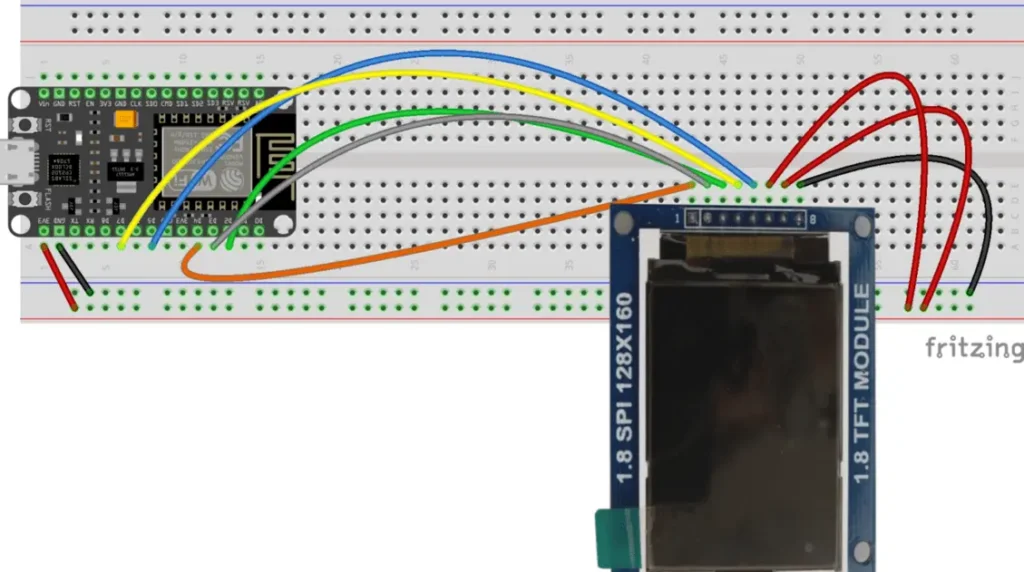
For greater convenience I will report the connections table below:
| TFT Display | ESP8266 |
| 1 | D4 |
| 2 | D3 |
| 3 | D2 |
| 4 | D7 |
| 5 | D5 |
| 6 | 3V3 |
| 7 | 3V3 |
| 8 | GND |
The sketch
Let’s create the PlatformIO project
We have already seen the procedure for creating a PlatformIO project in the article How to create a project for NodeMCU ESP8266 with PlatformIO.
Do not install the libraries indicated in the article but install the following libraries:
The Adafruit GFX Library by Adafruit library:

The Adafruit ST7735 and ST7789 Library by Adafruit library:

and the ArduinoJson by Benoit Blanchon library:

Now edit the platformio.ini file to add these two lines:
monitor_speed = 115200
upload_speed = 921600
so that it looks like this:
[env:nodemcuv2]
platform = espressif8266
board = nodemcuv2
monitor_speed = 115200
upload_speed = 921600
framework = arduino
lib_deps =
	adafruit/Adafruit GFX Library@^1.11.9
	adafruit/Adafruit ST7735 and ST7789 Library@^1.10.3
	bblanchon/ArduinoJson@^6.21.3
Obviously you can download the project from the following link:
Replace the main.cpp file of the project you created with the one present in the zip file.
Now let’s see how the sketch works.
Initially, in addition to the usual Arduino.h, the Adafruit graphics libraries for operating the display are included, the GPIOs to which the TFT display is connected are defined and the tft object that will manage the display is instantiated.
#include <Arduino.h>+

#include <Adafruit_GFX.h>      // include Adafruit graphics library
#include <Adafruit_ST7735.h>   // include Adafruit ST7735 TFT library

// ST7735 TFT module connections
#define TFT_RST   D4     // TFT RST pin is connected to NodeMCU pin D4 (GPIO2)
#define TFT_CS    D3     // TFT CS  pin is connected to NodeMCU pin D3 (GPIO0)
#define TFT_DC    D2     // TFT DC  pin is connected to NodeMCU pin D2 (GPIO4)

Adafruit_ST7735 tft = Adafruit_ST7735(TFT_CS, TFT_DC, TFT_RST);
Subsequently, the libraries for managing WiFi, for the http client that will operate with the API and for managing the received Json are included. Furthermore, the access parameters to the WiFi network are defined. So, instead of MY-SSID-WIFI you will have to put the real SSID of your WiFI network while instead of MY-PASSWORD-WIFI you will have to put the real password of your WiFI network:
#include <ESP8266WiFi.h>
#include <ESP8266HTTPClient.h>
#include <ArduinoJson.h>

const char* ssid = "MY-SSID-WIFI";
const char* password = "MY-PASSWORD-WIFI";
Subsequently, the Openweathermap host is defined which will be the starting point for the API, the city whose weather conditions you want to know is defined and the Openweathermap key is inserted. So, instead of MY-OPENWEATHERMAP-KEY you will have to put your key, the one you obtained after signing up to the Openweathermap service.
const char* host = "api.openweathermap.org";

String cityName = "Cagliari";
String appKey = "MY-OPENWEATHERMAP-KEY";
Now some display control variables are defined, the variables that regulate the timing of data request (every 60 seconds) and data display on the display (every 10 seconds) and the variables that collect the data from the Json and which will be displayed.
int flagScreen = 0;
int flagFirstData = 1;

int state = 0;

unsigned long measureDelayInternalCycle = 10000;                //    10s
unsigned long lastTimeRanInternalCycle;

unsigned long measureDelayExternalCycle = 60000;                //    60s
unsigned long measureDelayExternalCycleVariable;
unsigned long lastTimeRanExternalCycle;

String line = "";

String tempNow0 = "";
String pressure0 = "";
String humNow0 = "";
String weatherNow0 = "";
String dateNow0 = "";

String tempNow1 = "";
String pressure1 = "";
String humNow1 = "";
String weatherNow1 = "";
String dateNow1 = "";

String tempNow2 = "";
String pressure2 = "";
String humNow2 = "";
String weatherNow2 = "";
String dateNow2 = "";

String tempNow3 = "";
String pressure3 = "";
String humNow3 = "";
String weatherNow3 = "";
String dateNow3 = "";

String tempNow4 = "";
String pressure4 = "";
String humNow4 = "";
String weatherNow4 = "";
String dateNow4 = "";
Then follows a purely decorative graphic function that draws concentric rectangles when the device is turned on. It’s just to add some color!
void testfillrects(uint16_t color1, uint16_t color2) {
  tft.fillScreen(ST7735_BLACK);
  for (int16_t x=tft.width()-1; x > 6; x-=6) {
    tft.fillRect(tft.width()/2 -x/2, tft.height()/2 -x/2 , x, x, color1);
    tft.drawRect(tft.width()/2 -x/2, tft.height()/2 -x/2 , x, x, color2);
  }
}
The following functions inform the user about the connection status of the ESP8266 to WiFi:
void tftConnecting() {
  tft.setCursor(0, 0);
  tft.setRotation(3);
  tft.setTextColor(ST7735_RED);
  tft.setTextSize(2);
  tft.println("Connecting...");
  delay(1500);
}

void tftConnected() {
  tft.setCursor(0, 0);
  tft.setRotation(3);
  tft.setTextColor(ST7735_GREEN);
  tft.setTextSize(2);
  tft.println("Connected!");
  delay(2000);
  tft.fillScreen(ST7735_BLACK);
}
We now meet the setup function which initializes the serial port, initializes the display and shows the concentric squares, connects the ESP8266 to WiFi and checks the connection status (printing connection status messages on the display):
void setup(void) {
  Serial.begin(115200);
  delay(2000);

  tft.initR(INITR_BLACKTAB);
  tft.fillScreen(ST7735_BLACK);

  testfillrects(ST7735_YELLOW, ST7735_MAGENTA);

  WiFi.begin(ssid, password);

  tft.fillScreen(ST7735_BLACK);

  while (WiFi.status() != WL_CONNECTED)
  {
    delay(1000);
    Serial.println("Connecting...");
    tftConnecting();
  }

  if (WiFi.status() == WL_CONNECTED)
  {
    Serial.println("CONNECTED");
    tft.fillScreen(ST7735_BLACK);
    tftConnected();
  }
}
The loop function now begins.
Initially defines the WIFI client.
Furthermore, if it is the first time it is executed (i.e. the flagFirstData is 1) it sets the measureDelayExternalCycleVariable variable to 2000 (i.e. 2 seconds) so that the user does not have to wait long to receive the first data. In fact, its default value is 60000 (i.e. it makes a request to the API every 60 seconds). Subsequent times the flagFirstData variable will be set to 0 so the API will be consulted every 60 seconds.
WiFiClient client;
if(flagFirstData == 1) {
measureDelayExternalCycleVariable = 2000;
tft.setCursor(0, 0);
tft.setRotation(3);
tft.setTextWrap(true);
tft.setTextColor(ST7735_RED);
tft.setTextSize(2);
tft.println("Wait a few seconds.");
tft.println();
tft.println("I'm receiving the first data.");
} else {
measureDelayExternalCycleVariable = measureDelayExternalCycle;
}
Then follows the if block which, every measureDelayExternalCycleVariable ms, contacts the host, creates the API URL, receives the data in response to its request (i.e. receives the Json) and extracts the information from the Json by placing it in the appropriate variables:
if (millis() > lastTimeRanExternalCycle + measureDelayExternalCycleVariable)
{


    Serial.printf("\n[Connecting to %s ... ", host);
    if (client.connect(host, 80))
    {

        client.println("GET /data/2.5/forecast?q=" + cityName + "&APPID=" + appKey + "&mode=json&units=metric&cnt=7 HTTP/1.1");
        client.println("Host: api.openweathermap.org");
        client.println("User-Agent: ArduinoWiFi/1.1");
        client.println("Connection: close");
        client.println();

        while (client.connected() || client.available())
        {
        if (client.available())
        {
            line = client.readStringUntil('\n');
        }
        }
        client.stop();
    }
        else
        {
        Serial.println("connection failed!]");
        client.stop();
        }

        Serial.println("\n");
        Serial.println("-----------------------------------");
        Serial.println(line);
        Serial.println("-----------------------------------");


        int sizeResponse = line.length();

        DynamicJsonDocument doc(sizeResponse);

        deserializeJson(doc, line);

        JsonObject obj = doc.as<JsonObject>();

        String responseCode = obj["cod"];


        if(responseCode == "200") {

        tempNow0 = String(obj["list"][0]["main"]["temp"]);
        humNow0 = String(obj["list"][0]["main"]["humidity"]);
        pressure0 = String(obj["list"][0]["main"]["pressure"]);
        weatherNow0 = String(obj["list"][0]["weather"][0]["description"]);
        dateNow0 = String(obj["list"][0]["dt_txt"]);

        tempNow1 = String(obj["list"][1]["main"]["temp"]);
        humNow1 = String(obj["list"][1]["main"]["humidity"]);
        pressure1 = String(obj["list"][1]["main"]["pressure"]);
        weatherNow1 = String(obj["list"][1]["weather"][0]["description"]);
        dateNow1 = String(obj["list"][1]["dt_txt"]);

        tempNow2 = String(obj["list"][2]["main"]["temp"]);
        humNow2 = String(obj["list"][2]["main"]["humidity"]);
        pressure2 = String(obj["list"][2]["main"]["pressure"]);
        weatherNow2 = String(obj["list"][2]["weather"][0]["description"]);
        dateNow2 = String(obj["list"][2]["dt_txt"]);

        tempNow3 = String(obj["list"][3]["main"]["temp"]);
        humNow3 = String(obj["list"][3]["main"]["humidity"]);
        pressure3 = String(obj["list"][3]["main"]["pressure"]);
        weatherNow3 = String(obj["list"][3]["weather"][0]["description"]);
        dateNow3 = String(obj["list"][3]["dt_txt"]);

        tempNow4 = String(obj["list"][4]["main"]["temp"]);
        humNow4 = String(obj["list"][4]["main"]["humidity"]);
        pressure4 = String(obj["list"][4]["main"]["pressure"]);
        weatherNow4 = String(obj["list"][4]["weather"][0]["description"]);
        dateNow4 = String(obj["list"][4]["dt_txt"]);
        } else {
        tft.fillScreen(ST7735_BLACK);
        tft.setCursor(0, 0);
        tft.setRotation(3);
        tft.setTextWrap(true);
        tft.setTextColor(ST7735_RED);
        tft.setTextSize(2);
        tft.println("Something went wrong!");
        return;
    }


        flagFirstData = 0;
        lastTimeRanExternalCycle = millis();

}
The sketch ends with another if block that is executed every measureDelayInternalCycle ms (in our case 10 seconds) showing the various screens of collected data. With each turn of the loop function, the state variable is incremented to make the switch go to the next case. In case 4 the state variable is reset so that on the next turn the switch goes back to case 0:
    String dateMod = "";

    if (millis() > lastTimeRanInternalCycle + measureDelayInternalCycle)  {

    switch (state) {
        case 0:
        tft.fillScreen(ST7735_BLACK);
        tft.setCursor(0, 0);
        tft.setRotation(3);
        tft.setTextColor(ST7735_GREEN);
        tft.setTextSize(2);
        tft.println(cityName);
        tft.print("T: " + tempNow0);
        tft.println(" C");
        tft.print("H: " + humNow0);
        tft.print(" %");
        tft.println();
        tft.print("P: " + pressure0);
        tft.print(" hP");
        tft.println("\nWeather: ");
        tft.print(weatherNow0);
        tft.println();
        tft.println();
        for (int i = 5; i < dateNow0.length() - 3; i++) {
            dateMod += dateNow0[i];
        }
        dateMod.replace("-", "/");
        tft.println(dateMod);
        state = 1;
        break;
        case 1:
        tft.fillScreen(ST7735_BLACK);
        tft.setCursor(0, 0);
        tft.setRotation(3);
        tft.setTextColor(ST7735_GREEN);
        tft.setTextSize(2);
        tft.println(cityName);
        tft.print("T: " + tempNow1);
        tft.println(" C");
        tft.print("H: " + humNow1);
        tft.print(" %");
        tft.println();
        tft.print("P: " + pressure1);
        tft.print(" hP");
        tft.println("\nWeather: ");
        tft.print(weatherNow1);
        tft.println();
        tft.println();
        for (int i = 5; i < dateNow1.length() - 3; i++) {
            dateMod += dateNow1[i];
        }
        dateMod.replace("-", "/");
        tft.println(dateMod);
        state = 2;
        break;
        case 2:
        tft.fillScreen(ST7735_BLACK);
        tft.setCursor(0, 0);
        tft.setRotation(3);
        tft.setTextColor(ST7735_GREEN);
        tft.setTextSize(2);
        tft.println(cityName);
        tft.print("T: " + tempNow2);
        tft.println(" C");
        tft.print("H: " + humNow2);
        tft.print(" %");
        tft.println();
        tft.print("P: " + pressure2);
        tft.print(" hP");
        tft.println("\nWeather: ");
        tft.print(weatherNow2);
        tft.println();
        tft.println();
        for (int i = 5; i < dateNow2.length() - 3; i++) {
            dateMod += dateNow2[i];
        }
        dateMod.replace("-", "/");
        tft.println(dateMod);
        state = 3;
        break;
        case 3:
        tft.fillScreen(ST7735_BLACK);
        tft.setCursor(0, 0);
        tft.setRotation(3);
        tft.setTextColor(ST7735_GREEN);
        tft.setTextSize(2);
        tft.println(cityName);
        tft.print("T: " + tempNow3);
        tft.println(" C");
        tft.print("H: " + humNow3);
        tft.print(" %");
        tft.println();
        tft.print("P: " + pressure3);
        tft.print(" hP");
        tft.println("\nWeather: ");
        tft.print(weatherNow3);
        tft.println();
        tft.println();
        for (int i = 5; i < dateNow3.length() - 3; i++) {
            dateMod += dateNow3[i];
        }
        dateMod.replace("-", "/");
        tft.println(dateMod);
        state = 4;
        break;
        case 4:
        tft.fillScreen(ST7735_BLACK);
        tft.setCursor(0, 0);
        tft.setRotation(3);
        tft.setTextColor(ST7735_GREEN);
        tft.setTextSize(2);
        tft.println(cityName);
        tft.print("T: " + tempNow4);
        tft.println(" C");
        tft.print("H: " + humNow4);
        tft.print(" %");
        tft.println();
        tft.print("P: " + pressure4);
        tft.print(" hP");
        tft.println("\nWeather: ");
        tft.print(weatherNow4);
        tft.println();
        tft.println();
        for (int i = 5; i < dateNow4.length() - 3; i++) {
            dateMod += dateNow4[i];
        }
        dateMod.replace("-", "/");
        tft.println(dateMod);
        state = 0;
        break;
        default:
        tft.setCursor(0, 0);
        tft.setRotation(3);
        tft.setTextWrap(true);
        tft.setTextColor(ST7735_RED);
        tft.setTextSize(2);
        tft.println("Undefined option");
        break;
        }

    lastTimeRanInternalCycle = millis();
}
And here’s a nice video demonstration of our weather station in operation
As you can see the forecast is on a 3 hour basis. The display will show them cyclically while the Json is updated every 60 seconds. The last line represents month/day hours:minutes (the year was omitted due to space constraints).
Newsletter
If you want to be informed about the release of new articles, subscribe to the newsletter. Before subscribing to the newsletter read the page Privacy Policy (UE)
If you want to unsubscribe from the newsletter, click on the link that you will find in the newsletter email.